


One common anti-debugging technique is to make use of the Windows API to simply mark your threads as invisible to the debugger. This isn't officially documented by Microsoft but it has been quite robust across windows versions.
The documentation for NtSetInformationThread says we can alter the following parameters on our thread:
- ThreadPriority
- ThreadBasePriority
- ThreadPagePriority
- ThreadPowerThrottlingState
But there are many more we can work with. We can set ThreadHideFromDebugger as follows and this will mean any exceptions skip the debugger and either hit SEH or explode and crash the app:
// you might need to define ThreadHideFromDebugger = 0x11
NtSetInformationThread(GetCurrentThread(),ThreadHideFromDebugger, 0, 0);
This doesn't stop anyone debugging from setting breakpoints in your code, but it means that if they do set a software breakpoint (implemented as int 3) then the exception that this triggers will crash your thread instead of allowing the debugger to step through and analyse your code more closely.
The obvious way around this is to patch NtSetInformationThread, but this can be circumvented by making the syscall directly, or by calling NtQueryInformationThread to check if the flag was set (although this can also be patch, and so on and so forth...).
Today I'd like to present my own approach which involves resetting the flag on the internal thread structure.
Under the hood
Open up ntoskrnl in your favourite disassembler and navigate to NtSetInformationThread. We're trying to track ThreadHideFromDebugger (0x11, 17 in decimal) through the code. We eventually get to a massive switch statement and find this bit of code:
if ( ThreadInformationLength )
  return STATUS_INFO_LENGTH_MISMATCH;
result = ObReferenceObjectByHandleWithTag(hThread, THREAD_SET_INFORMATION, PsThreadType, UserMode, 0x79517350, &Object, 0);
if ( result < 0 )
  return result;
_InterlockedOr((volatile LONG *)Object + 324, 4);
This gets a pointer to the ETHREAD structure for the thread and sets a bit in an undocumented flags field.
If we browse further we can see similar calls, e.g.
// ThreadBreakOnTermination
if ( ThreadInformation )
  _InterlockedOr((volatile LONG *)Object + 324, 0x20);
else
  _InterlockedAnd((volatile LONG *)Object + 324, 0xFFFFFFDF);
// 43 = ?
if ( ThreadInformation )
  _InterlockedOr((volatile LONG *)Object + 324, 0x80000);
else
  _InterlockedAnd((volatile LONG *)Object + 324, 0xFFF7FFFF);
// 46 = ?
if ( v93 )
  _InterlockedOr((volatile DWORD *)Object + 324, 0x200000);
else
  _InterlockedAnd((volatile DWORD *)Object + 324, 0xFFDFFFFF);
So it's clear that this field is made to have flags switched both on and off, and it's a little weird that only the ThreadHideFromDebugger field is one that latches on.
There's nothing stopping us from turning this flag off again ourselves though... we'll have to write our own driver, but that's entirely doable.
To the kernel
We need to do the following things:
- Get a reference to the thread
- Convert the thread into a pointer where we have write access
- Mask out third bit (0x04) to enable debugging again
Because we're communicating with a driver we can't pass the handle from our application as it won't translate correctly, so we'll need to do this by thread ID instead. Here's what the kernel code looks like to enable debugging again:
LONG* pEthread;
NTSTATUS result = PsLookupThreadByThreadId((HANDLE)input, (PETHREAD*)&pEthread);
if (result < 0) {
    DebugMessage("armswideopen: Couldn't get pointer to ETHREAD struct, error: %X\n", result);
}
else {
    DebugMessage("armswideopen: Unsetting ThreadHideFromDebugger flag\n");
    _InterlockedAnd((volatile LONG*)(pEthread + ethreadOffset), (0xFFFFFFFF - 4));

    ObDereferenceObject(pEthread);
}
You'll note we've use a variable for ethreadOffset, the reason for this is that the ETHREAD struct varies from build to build. I've been developing this on build 19042, but testing it on the free VM that Microsoft supplies for testing Edge and that's running build 17763 where the offset is 436.
The link to the source is at the bottom, and you'll note it includes this plus the IOCTL code required to communicate with the driver.
Watching it in action
I've written a simple app that we can breakpoint at various stages to see whether it crashes. The app looks like this:
// initial state
std::cout << "isDebuggerBlocked: " << GetThreadDebuggableStatus(GetCurrentThread()) << std::endl;

// disable debugging
SetThreadNotDebuggable(GetCurrentThread());
std::cout << "Set ThreadHideFromDebugger" << std::endl;

// should be blocked now
std::cout << "isDebuggerBlocked: " << GetThreadDebuggableStatus(GetCurrentThread()) << std::endl;

// enable debugging
SetThreadDebuggable(hDriver, GetCurrentThreadId());
std::cout << "Reset ThreadHideFromDebugger" << std::endl;

// should be unblocked now
std::cout << "isDebuggerBlocked: " << GetThreadDebuggableStatus(GetCurrentThread()) << std::endl;

// wait
std::cin >> result;
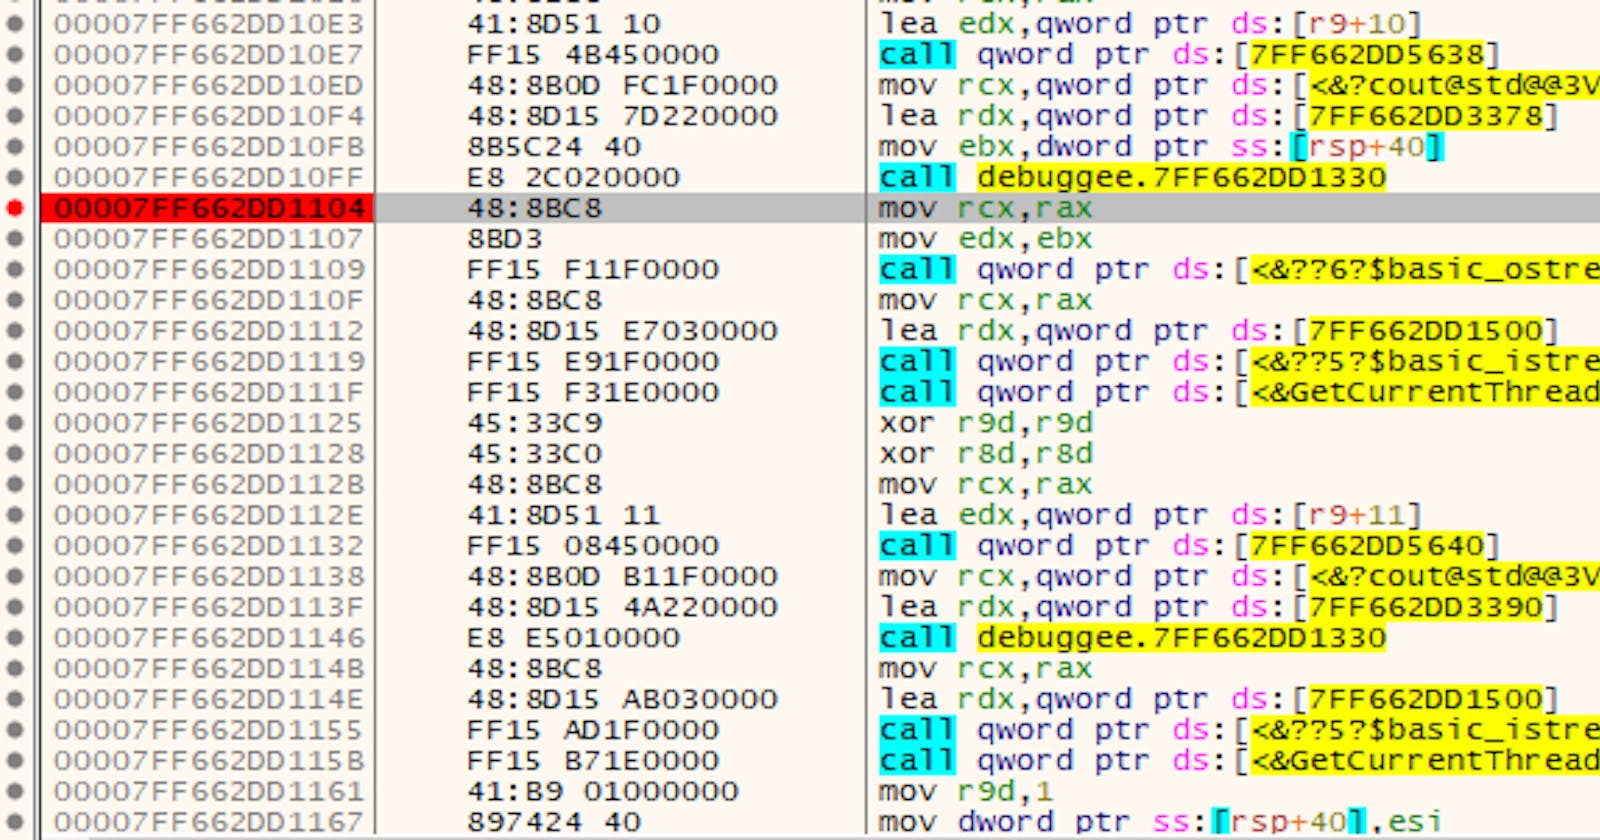
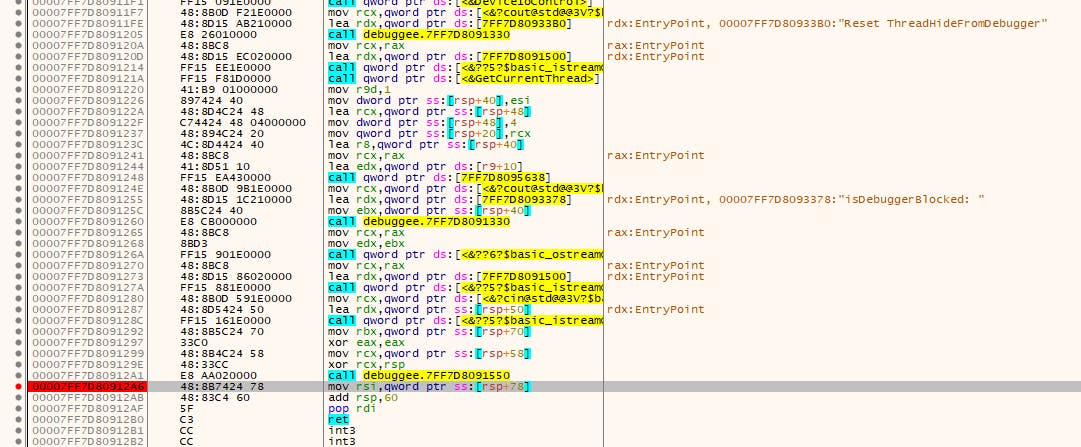
So let's try breakpointing at the start:
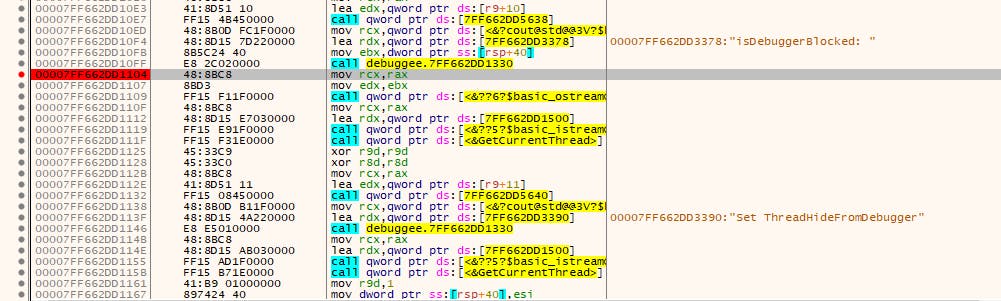
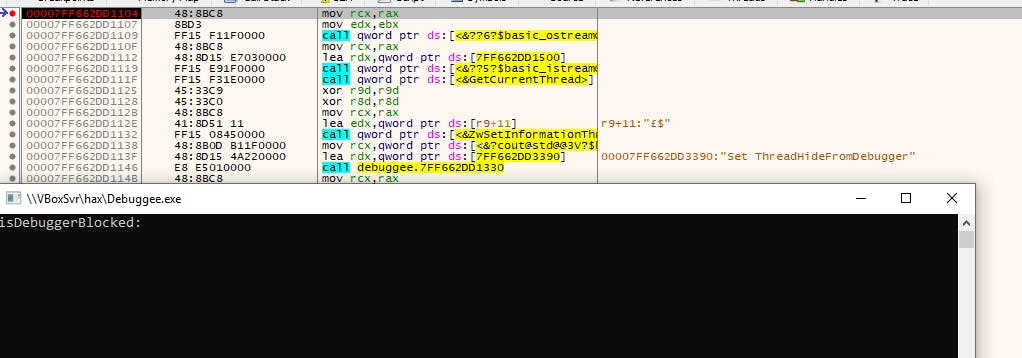
Breakpoint works fine. What about if we breakpoint after we set ThreadHideFromDebugger?
Not much to see here because it just crashes and disappears.
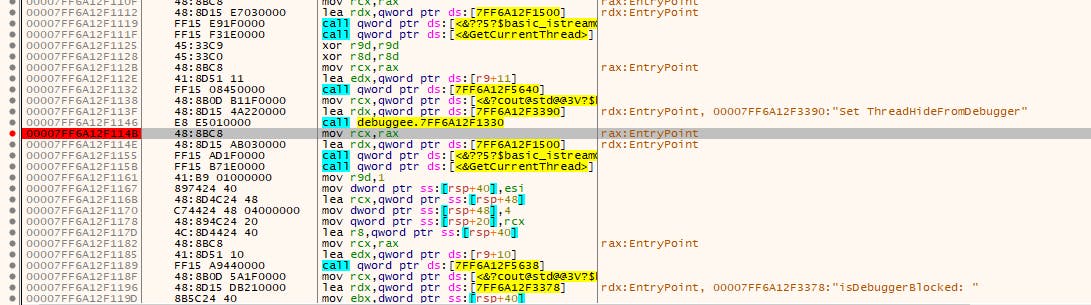
Let's try putting a breakpoint after we've reset the ThreadHideFromDebugger flag:
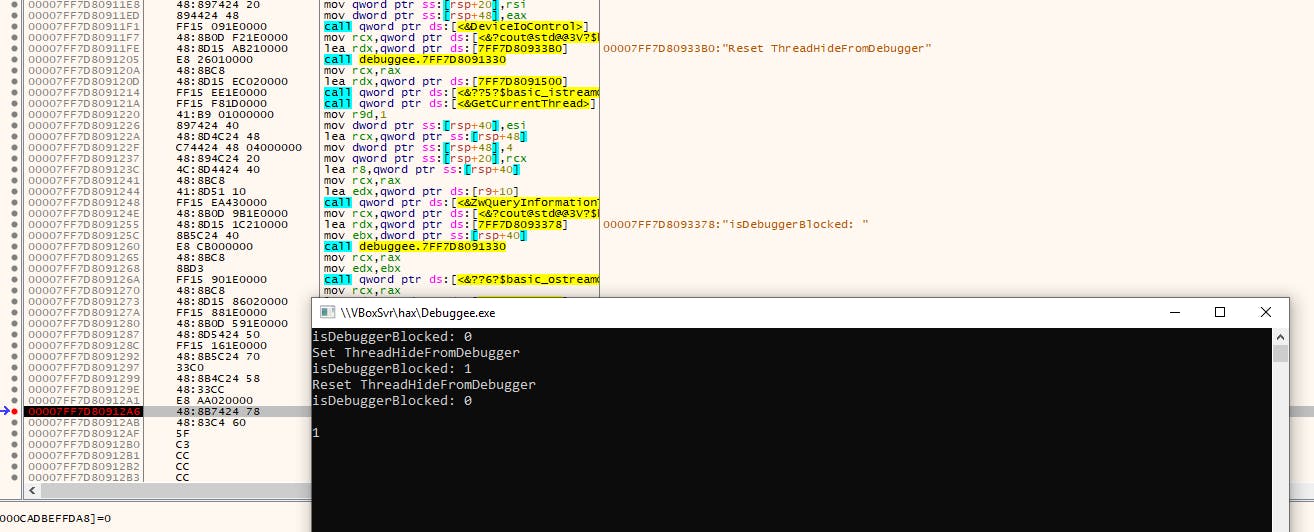
Not only does NtQueryInformationThread confirm that we've disabled ThreadHideFromDebugger, but our breakpoints are working again!
Try it out
Code is at github.com/samrussell/armswideopen
To get your driver installable and debuggable I recomend the steps at medium.com/@eaugusto/setting-up-a-windows-7..
Install and start the driver as follows:
sc create armswideopen binPath=k:\armswideopen.sys type=kernel

sc start armswideopen

sc stop armswideopen